Key concepts: Horizontal scaling > vertical. CAP theorem = pick 2 of consistency/availability/partition-tolerance. Caching with Cache-Aside pattern. SQL for transactions, NoSQL for scale. Load balancer distributes traffic. Sharding splits data across DBs. Design for 3-5x expected peak. Always start with requirements.
I spent years reading system design books and articles, watching conference talks, and building actual systems. This cheat sheet is everything I wish I had when I started. It covers the concepts that actually matter when building systems that scale.
Use this as a reference when designing systems, preparing for interviews, or reviewing architecture decisions.
Table of Contents
- The System Design Process
- Scalability Fundamentals
- Load Balancing
- Caching
- Databases
- Message Queues
- API Design
- Distributed Systems Concepts
- Common Architecture Patterns
- Monitoring and Observability
- Capacity Estimation
- Quick Reference Tables
The System Design Process
Before diving into components, understand the process. Every good design starts with requirements.
Step 1: Clarify Requirements
Never start designing without understanding what you are building.
Functional Requirements (what the system does):
- What features does the system need?
- Who are the users?
- What are the core use cases?
Non-Functional Requirements (how well it does it):
- Scale: How many users? How much data?
- Performance: What latency is acceptable?
- Availability: How much downtime is tolerable?
- Consistency: Is eventual consistency acceptable?
Step 2: Estimate Scale
Back-of-envelope calculations set the foundation. Get the order of magnitude right.
| Metric | Question to Ask |
|---|---|
| Users | Daily active users? Peak concurrent users? |
| Storage | How much data per user? How long do we keep it? |
| Bandwidth | Average request size? Uploads vs downloads? |
| Throughput | Requests per second? Read-heavy or write-heavy? |
Step 3: Define High-Level Design
Draw the main components and how data flows between them.
flowchart LR
    C[Clients] --> LB[Load Balancer]
    LB --> S1[Server 1]
    LB --> S2[Server 2]
    LB --> S3[Server 3]
    S1 --> Cache[(Cache)]
    S2 --> Cache
    S3 --> Cache
    Cache --> DB[(Database)]
    S1 --> Q[Message Queue]
    S2 --> Q
    S3 --> Q
    Q --> W[Workers]

    style LB fill:#2d3748,stroke:#4a5568,color:#e2e8f0
    style Cache fill:#1a365d,stroke:#2b6cb0,color:#bee3f8
    style DB fill:#1a365d,stroke:#2b6cb0,color:#bee3f8
    style Q fill:#234e52,stroke:#319795,color:#b2f5ea
Step 4: Deep Dive into Components
Pick the most critical or complex components and design them in detail. This includes database schemas, API contracts, and algorithms.
Step 5: Address Bottlenecks and Trade-offs
Every design has trade-offs. Identify potential bottlenecks and explain how you would handle them.
Scalability Fundamentals
Scalability is the ability to handle increased load. There are two approaches.
Vertical Scaling (Scale Up)
Add more resources to existing machines.
| Pros | Cons |
|---|---|
| Simple to implement | Hardware limits (you cannot buy a bigger server indefinitely) |
| No code changes needed | Single point of failure |
| Easier to manage | Expensive at high end |
| No distributed complexity | Downtime during upgrades |
Horizontal Scaling (Scale Out)
Add more machines to distribute the load.
| Pros | Cons |
|---|---|
| Near unlimited scaling | More complex architecture |
| Better fault tolerance | Requires distributed systems knowledge |
| Cost effective (commodity hardware) | Data consistency challenges |
| No single point of failure | Network overhead |
flowchart TB
    subgraph Vertical["Vertical Scaling"]
        direction TB
        V1[Small Server] --> V2[Medium Server]
        V2 --> V3[Large Server]
    end

    subgraph Horizontal["Horizontal Scaling"]
        direction LR
        H1[Server]
        H2[Server]
        H3[Server]
        H4[Server]
    end

    style V1 fill:#2d3748,stroke:#4a5568,color:#e2e8f0
    style V2 fill:#2d3748,stroke:#4a5568,color:#e2e8f0
    style V3 fill:#2d3748,stroke:#4a5568,color:#e2e8f0
    style H1 fill:#1a365d,stroke:#2b6cb0,color:#bee3f8
    style H2 fill:#1a365d,stroke:#2b6cb0,color:#bee3f8
    style H3 fill:#1a365d,stroke:#2b6cb0,color:#bee3f8
    style H4 fill:#1a365d,stroke:#2b6cb0,color:#bee3f8
Rule of thumb: Start simple with vertical scaling, move to horizontal when you hit limits or need fault tolerance.
Load Balancing
A load balancer distributes traffic across multiple servers.
Why Use Load Balancers?
- Availability: If one server dies, traffic goes to healthy servers
- Scalability: Add servers behind the load balancer as traffic grows
- Performance: Prevent any single server from being overwhelmed
Load Balancing Algorithms
| Algorithm | How It Works | Best For |
|---|---|---|
| Round Robin | Requests go to servers in rotation | Equal-capacity servers, stateless apps |
| Weighted Round Robin | Higher-weight servers get more traffic | Mixed-capacity server fleet |
| Least Connections | New requests go to server with fewest active connections | Long-running requests, varying request times |
| IP Hash | Client IP determines server (sticky sessions) | Stateful applications, session affinity |
| Least Response Time | Fastest responding server gets next request | Performance-critical applications |
Layer 4 vs Layer 7 Load Balancing
Layer 4 (Transport Layer) routes based on IP address and port. Fast but cannot inspect content.
flowchart LR
    C[Client] --> LB[Load Balancer]
    LB --> S1[Server 1]
    LB --> S2[Server 2]
    LB --> S3[Server 3]

    style LB fill:#2d3748,stroke:#4a5568,color:#e2e8f0
    style S1 fill:#1a365d,stroke:#2b6cb0,color:#bee3f8
    style S2 fill:#1a365d,stroke:#2b6cb0,color:#bee3f8
    style S3 fill:#1a365d,stroke:#2b6cb0,color:#bee3f8
Layer 7 (Application Layer) routes based on URL, headers, cookies. Smarter but more processing overhead.
flowchart LR
    C[Client] --> LB[Load Balancer]
    LB -->|/api/*| API[API Servers]
    LB -->|/static/*| Static[Static Servers]
    LB -->|/images/*| Images[Image Servers]

    style LB fill:#234e52,stroke:#319795,color:#b2f5ea
    style API fill:#1a365d,stroke:#2b6cb0,color:#bee3f8
    style Static fill:#1a365d,stroke:#2b6cb0,color:#bee3f8
    style Images fill:#1a365d,stroke:#2b6cb0,color:#bee3f8
| Layer 4 | Layer 7 |
|---|---|
| Faster (less processing) | Smarter routing (URL, headers, cookies) |
| Cannot inspect content | Can cache, compress, SSL terminate |
| Simple configuration | Content-based routing |
| TCP/UDP level | HTTP/HTTPS level |
If you want the client-side picture of how DNS, TCP, TLS, and HTTP requests fit together before traffic ever hits a load balancer, see what happens when you type a URL in the browser.
Popular Load Balancers
- Nginx: Fast, widely used, great for HTTP
- HAProxy: High performance, TCP and HTTP
- AWS ELB/ALB: Managed, integrates with AWS
- Cloudflare: Edge load balancing with CDN
Caching
Caching stores frequently accessed data in fast storage to reduce latency and database load.
Where to Cache
flowchart LR
    C[Client] --> CDN[CDN Cache]
    CDN --> LB[Load Balancer]
    LB --> App[Application]
    App --> AppCache[App Cache]
    AppCache --> DistCache[Distributed Cache]
    DistCache --> DB[(Database)]

    style CDN fill:#234e52,stroke:#319795,color:#b2f5ea
    style AppCache fill:#234e52,stroke:#319795,color:#b2f5ea
    style DistCache fill:#234e52,stroke:#319795,color:#b2f5ea
| Cache Layer | What It Caches | Tools |
|---|---|---|
| Browser | Static assets, API responses | HTTP headers (Cache-Control) |
| CDN | Static files, media, edge content | Cloudflare, CloudFront, Fastly |
| Application | Computed values, session data | In-memory (Guava, Caffeine) |
| Distributed | Shared data across servers | Redis, Memcached |
| Database | Query results, frequently accessed rows | MySQL query cache, PostgreSQL |
Caching Strategies
I covered these in depth in Caching Strategies Explained. Here is the summary:
| Strategy | How It Works | Best For |
|---|---|---|
| Cache-Aside | App checks cache, fetches from DB on miss, populates cache | General purpose, most control |
| Read-Through | Cache fetches from DB automatically on miss | Read-heavy, simpler code |
| Write-Through | Writes go to cache and DB synchronously | Consistency critical |
| Write-Behind | Writes go to cache, async to DB later | High write throughput |
| Write-Around | Writes bypass cache, go to DB only | Write-once data |
Cache Eviction Policies
When cache is full, what gets removed?
| Policy | Removes | Best For |
|---|---|---|
| LRU | Least Recently Used items | General purpose, most common |
| LFU | Least Frequently Used items | Stable access patterns |
| FIFO | Oldest items | Simple use cases |
| TTL | Expired items | Time-sensitive data |
Cache Invalidation
The hardest problem in caching. Options include:
- TTL-based: Expire after fixed time (simple, allows staleness window)
- Event-based: Invalidate on data change (immediate, complex to track)
- Version-based: Include version in cache key (no stale data, more misses)
Databases
Database choice is one of the most important architectural decisions.
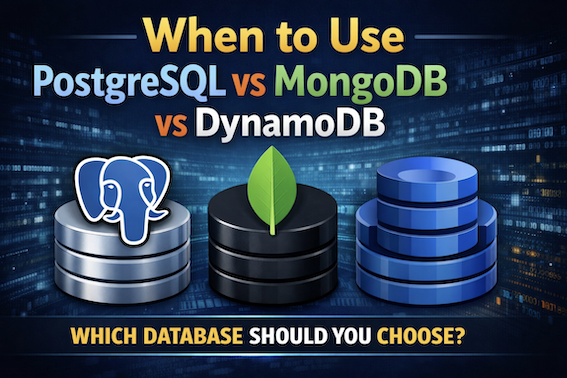
SQL vs NoSQL
| SQL (Relational) | NoSQL |
|---|---|
| Structured data, fixed schema | Flexible or schema-less |
| ACID transactions | Eventual consistency (often) |
| Complex queries and joins | Simple queries, denormalized data |
| Vertical scaling primarily | Horizontal scaling built-in |
| PostgreSQL, MySQL, Oracle | MongoDB, Cassandra, DynamoDB |
When to Use SQL
Complex relationships between data (joins)
Transactions are critical (financial systems)
Data integrity and constraints matter
Ad-hoc queries and reporting
When to Use NoSQL
Massive scale (petabytes of data)
Flexible or evolving schema
High write throughput
Geographic distribution
NoSQL Types
| Type | Data Model | Examples | Use Case |
|---|---|---|---|
| Document | JSON documents | MongoDB, CouchDB | Content management, catalogs |
| Key-Value | Simple key to value | Redis, DynamoDB | Caching, sessions |
| Column-Family | Wide columns | Cassandra, HBase | Time series, analytics |
| Graph | Nodes and edges | Neo4j, Amazon Neptune | Social networks, recommendations |
Database Scaling Patterns
Replication
Copies of data across multiple servers.
flowchart LR
    App[Application] --> Primary[(Primary)]
    Primary --> R1[(Replica 1)]
    Primary --> R2[(Replica 2)]
    Primary --> R3[(Replica 3)]
    App -.->|Reads| R1
    App -.->|Reads| R2
    App -.->|Reads| R3

    style Primary fill:#1a365d,stroke:#2b6cb0,color:#bee3f8
    style R1 fill:#2d3748,stroke:#4a5568,color:#e2e8f0
    style R2 fill:#2d3748,stroke:#4a5568,color:#e2e8f0
    style R3 fill:#2d3748,stroke:#4a5568,color:#e2e8f0
- Leader-Follower: One primary handles writes, replicas handle reads
- Leader-Leader: Multiple primaries, complex conflict resolution
- Benefit: Read scalability, fault tolerance
Sharding (Partitioning)
Split data across multiple databases.
flowchart TB
    App[Application] --> Router[Shard Router]
    Router --> S1[(Shard 1: Users A-M)]
    Router --> S2[(Shard 2: Users N-Z)]
    Router --> S3[(Shard 3: Premium Users)]

    style Router fill:#234e52,stroke:#319795,color:#b2f5ea
    style S1 fill:#1a365d,stroke:#2b6cb0,color:#bee3f8
    style S2 fill:#1a365d,stroke:#2b6cb0,color:#bee3f8
    style S3 fill:#1a365d,stroke:#2b6cb0,color:#bee3f8
| Sharding Strategy | How It Works | Pros | Cons |
|---|---|---|---|
| Hash-based | Hash of key determines shard | Even distribution | Resharding is painful |
| Range-based | Key ranges determine shard | Range queries work | Hot spots possible |
| Geographic | Location determines shard | Low latency | Complex for global users |
| Directory-based | Lookup table maps keys to shards | Flexible | Lookup is bottleneck |
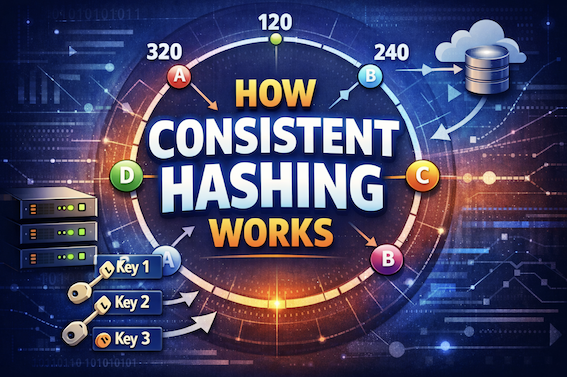
Use consistent hashing for hash-based sharding to minimize data movement when servers are added or removed. See how Slack uses workspace-based sharding and Shopify shards by shop_id in their production systems.
Message Queues
Message queues decouple services and enable asynchronous processing.
Why Use Queues?
sequenceDiagram
    participant User
    participant API
    participant Queue
    participant Worker
    participant Email

    User->>API: Place Order
    API->>Queue: OrderCreated event
    API->>User: Success (200ms)

    Note over Queue,Email: Async Processing
    Queue->>Worker: Process order
    Worker->>Email: Send confirmation
- Decoupling: Services don’t need to know about each other
- Resilience: Failed consumers don’t crash producers
- Buffering: Absorb traffic spikes
- Scalability: Add consumers as needed
For a deep dive, see Role of Queues in System Design.
Queue Patterns
| Pattern | Description | Use Case |
|---|---|---|
| Point-to-Point | One producer, one consumer per message | Task distribution |
| Pub/Sub | One producer, many consumers get same message | Event notifications |
| Work Queue | Multiple consumers compete for messages | Parallel processing |
| Dead Letter Queue | Failed messages go here after retries | Error handling |
Popular Message Queues
| Tool | Best For | Throughput |
|---|---|---|
| Kafka | Event streaming, log aggregation, replay | Millions/sec |
| RabbitMQ | Complex routing, traditional messaging | Thousands/sec |
| SQS | Simple AWS-native queuing | Thousands/sec |
| Redis Streams | Lightweight streaming | Hundreds of thousands/sec |
See How Kafka Works for a complete breakdown.
API Design
APIs are contracts between services. Design them carefully.
REST vs GraphQL vs gRPC
| Aspect | REST | GraphQL | gRPC |
|---|---|---|---|
| Data Format | JSON | JSON | Protocol Buffers |
| Contract | Implicit (conventions) | Schema-defined | Protocol definition |
| Over-fetching | Common | Solved (request what you need) | N/A |
| Learning Curve | Low | Medium | Higher |
| Best For | Public APIs, CRUD | Flexible frontends | Internal microservices |
REST Best Practices
1
2
3
4
5
6
7
8
9
10
11
# Good URL design
GET    /users              # List users
GET    /users/123          # Get user 123
POST   /users              # Create user
PUT    /users/123          # Update user 123
DELETE /users/123          # Delete user 123

# Bad URL design
GET    /getUsers
POST   /createUser
GET    /users/delete/123
API Versioning
| Strategy | Example | Pros | Cons |
|---|---|---|---|
| URL Path | /v1/users |
Clear, easy caching | URL changes |
| Query Param | /users?version=1 |
Single endpoint | Easy to miss |
| Header | Accept: application/vnd.api.v1+json |
Clean URLs | Hidden versioning |
Rate Limiting
Protect your API from abuse and overload.
| Algorithm | How It Works | Best For |
|---|---|---|
| Token Bucket | Tokens added at fixed rate, requests consume tokens | Burst-friendly, most common |
| Sliding Window | Count requests in rolling time window | Smooth rate limiting |
| Fixed Window | Count requests in fixed intervals | Simple to implement |
For implementation details, see Dynamic Rate Limiter System Design.
Distributed Systems Concepts
When you scale beyond a single machine, you enter distributed systems territory.
CAP Theorem
In a distributed system, during a network partition, you must choose between:
flowchart TB
    CAP[CAP Theorem]
    CAP --> C[Consistency]
    CAP --> A[Availability]
    CAP --> P[Partition Tolerance]

    C --- Note1[All nodes see same data]
    A --- Note2[Every request gets response]
    P --- Note3[System works despite network failures]

    style C fill:#1a365d,stroke:#2b6cb0,color:#bee3f8
    style A fill:#234e52,stroke:#319795,color:#b2f5ea
    style P fill:#2d3748,stroke:#4a5568,color:#e2e8f0
- CP System: Consistency + Partition Tolerance (blocks during partition)
- Example: ZooKeeper, etcd, traditional banking
- AP System: Availability + Partition Tolerance (may serve stale data)
- Example: Cassandra, DynamoDB, DNS
Reality: Network partitions are inevitable. You’re always choosing between C and A.
Consistency Models
| Model | Guarantee | Example |
|---|---|---|
| Strong | Read always returns latest write | Bank balance |
| Eventual | Reads will eventually see latest write | Social media likes |
| Causal | Related events appear in order | Chat messages |
| Read-your-writes | You see your own writes immediately | Shopping cart |
Consensus Algorithms
How do distributed nodes agree on a value?
| Algorithm | Used In | Complexity |
|---|---|---|
| Paxos | Chubby, Spanner | Notoriously complex |
| Raft | etcd, Consul | Easier to understand |
| ZAB | ZooKeeper | Similar to Paxos |
See Paxos Distributed Consensus for details.
Distributed Transactions
When a transaction spans multiple services:
| Pattern | How It Works | Consistency |
|---|---|---|
| Two-Phase Commit | Coordinator asks all nodes, then commits | Strong (but slow) |
| Saga | Chain of local transactions with compensations | Eventual |
| Outbox Pattern | Write to DB and outbox table atomically | Eventual |
See Two-Phase Commit for implementation details.
Common Architecture Patterns
Monolith vs Microservices
flowchart TB
    subgraph Monolith["Monolith"]
        direction TB
        M1[User Module]
        M2[Order Module]
        M3[Payment Module]
        M1 --- M2
        M2 --- M3
    end

    subgraph Microservices["Microservices"]
        direction TB
        U[User Service]
        O[Order Service]
        P[Payment Service]
        U <-->|API| O
        O <-->|API| P
    end

    style M1 fill:#2d3748,stroke:#4a5568,color:#e2e8f0
    style M2 fill:#2d3748,stroke:#4a5568,color:#e2e8f0
    style M3 fill:#2d3748,stroke:#4a5568,color:#e2e8f0
    style U fill:#1a365d,stroke:#2b6cb0,color:#bee3f8
    style O fill:#1a365d,stroke:#2b6cb0,color:#bee3f8
    style P fill:#1a365d,stroke:#2b6cb0,color:#bee3f8
| Monolith | Microservices |
|---|---|
| Simple deployment | Independent deployments |
| Easy debugging | Distributed debugging |
| Shared database | Database per service |
| Tight coupling | Network overhead |
| Team coordination needed | Team autonomy |
Most teams should start with a monolith and extract services when needed. See Modular Monolith Architecture for a middle ground.
Event-Driven Architecture
Services communicate through events instead of direct calls.
flowchart LR
    OS[Order Service] -->|OrderCreated| EB[Event Bus]
    EB --> IS[Inventory Service]
    EB --> NS[Notification Service]
    EB --> AS[Analytics Service]

    style EB fill:#234e52,stroke:#319795,color:#b2f5ea
Benefits:
- Loose coupling between services
- Services can be added/removed without affecting others
- Natural audit log of events
Challenges:
- Eventual consistency
- Debugging across services
- Event ordering
CQRS (Command Query Responsibility Segregation)
Separate read and write models.
flowchart LR
    App[Application]
    App -->|Commands| WM[Write Model]
    App -->|Queries| RM[Read Model]
    WM --> WDB[(Write DB)]
    WDB -.->|Sync| RDB[(Read DB)]
    RM --> RDB

    style WM fill:#1a365d,stroke:#2b6cb0,color:#bee3f8
    style RM fill:#234e52,stroke:#319795,color:#b2f5ea
Use when read and write patterns are very different. See CQRS Pattern Guide for details.
Monitoring and Observability
You cannot fix what you cannot see.
The Three Pillars
| Pillar | What It Shows | Tools |
|---|---|---|
| Metrics | Numerical measurements over time | Prometheus, Datadog, CloudWatch |
| Logs | Discrete events with details | ELK Stack, Splunk, Loki |
| Traces | Request path across services | Jaeger, Grafana Tempo, Zipkin, X-Ray |
Use OpenTelemetry as the vendor-neutral instrumentation layer to collect all three signals and export to any backend.
Key Metrics to Monitor
| Metric | What It Measures | Alert When |
|---|---|---|
| Request Rate | Requests per second | Sudden drop or spike |
| Error Rate | Percentage of errors | Above threshold (e.g., > 1%) |
| Latency (p50, p95, p99) | Response time distribution | p99 exceeds SLA |
| Saturation | Resource utilization | CPU, memory, disk > 80% |
SLI, SLO, SLA
| Term | Definition | Example |
|---|---|---|
| SLI (Service Level Indicator) | Measurement of service | Request latency, error rate |
| SLO (Service Level Objective) | Target for the SLI | 99.9% requests under 200ms |
| SLA (Service Level Agreement) | Contract with customers | 99.5% uptime or refund |
For more details, see SLI, SLO, SLA Explained.
Capacity Estimation
Back-of-envelope calculations help validate designs.
Common Numbers to Know
| Resource | Value |
|---|---|
| L1 cache reference | 0.5 ns |
| RAM reference | 100 ns |
| SSD read | 100 μs |
| Network round trip (same datacenter) | 500 μs |
| Network round trip (cross-country) | 150 ms |
| Disk seek | 10 ms |
Storage Calculations
1
2
3
4
5
6
Users: 100 million
Data per user: 1 KB profile + 10 KB posts = 11 KB
Total: 100M × 11 KB = 1.1 TB

With 3x replication: 3.3 TB
Growth over 3 years (2x): 6.6 TB
Throughput Calculations
1
2
3
4
5
6
7
Daily active users: 10 million
Requests per user per day: 20
Daily requests: 200 million
Requests per second: 200M / 86,400 = ~2,300 RPS

Peak (3x average): ~7,000 RPS
Design for: 10,000 RPS (headroom)
Bandwidth Calculations
1
2
3
Requests per second: 10,000
Average response size: 10 KB
Bandwidth: 10,000 × 10 KB = 100 MB/s = 800 Mbps
Quick Reference Tables
Database Decision Matrix
| Need | Choose |
|---|---|
| ACID transactions | PostgreSQL, MySQL |
| Flexible schema | MongoDB, DynamoDB |
| Time series data | InfluxDB, TimescaleDB |
| Graph relationships | Neo4j |
| High write throughput | Cassandra |
| Caching/sessions | Redis |
Communication Protocol Decision
| Need | Choose |
|---|---|
| Public API, broad compatibility | REST |
| Flexible queries, multiple clients | GraphQL |
| Internal services, high performance | gRPC |
| Real-time bidirectional | WebSocket |
| One-way server push | Server-Sent Events |
For real-time options, see WebSockets Explained, Server-Sent Events, and Long Polling.
Scaling Decision Matrix
| Problem | Solution |
|---|---|
| Database reads too slow | Add read replicas, caching |
| Database writes too slow | Sharding, write-behind cache |
| Single server overloaded | Horizontal scaling with load balancer |
| Too much traffic for one region | CDN, geographic distribution |
| Service calls too slow | Message queues, async processing |
| Downstream service failures cascade | Circuit breaker pattern, bulkheads |
Common System Design Numbers
| System | Scale |
|---|---|
| Twitter (X) | 500 million tweets/day |
| 8.5 billion searches/day | |
| Netflix | 15% of global internet traffic |
| 100 billion messages/day | |
| Uber | 1 million matches/minute peak |
Putting It All Together
Here is a typical architecture for a scalable web application:
flowchart TB
    Users[Users] --> CDN[CDN]
    CDN --> LB[Load Balancer]
    LB --> API1[API Server]
    LB --> API2[API Server]
    LB --> API3[API Server]

    API1 --> Cache[(Redis Cache)]
    API2 --> Cache
    API3 --> Cache

    Cache --> DB[(Primary DB)]
    DB --> R1[(Replica)]
    DB --> R2[(Replica)]

    API1 --> Queue[Message Queue]
    API2 --> Queue
    API3 --> Queue

    Queue --> W1[Worker]
    Queue --> W2[Worker]

    W1 --> S3[(Object Storage)]
    W2 --> Search[(Search Index)]

    style LB fill:#234e52,stroke:#319795,color:#b2f5ea
    style Cache fill:#1a365d,stroke:#2b6cb0,color:#bee3f8
    style DB fill:#1a365d,stroke:#2b6cb0,color:#bee3f8
    style Queue fill:#2d3748,stroke:#4a5568,color:#e2e8f0
Components:
- CDN: Serves static assets close to users
- Load Balancer: Distributes traffic, provides failover
- API Servers: Handle business logic, stateless for easy scaling
- Cache: Reduce database load, improve latency
- Database: Primary for writes, replicas for reads
- Message Queue: Decouple services, handle async work
- Workers: Process background jobs
- Object Storage: Store files, media
- Search Index: Full-text search capabilities
Further Reading
These posts go deeper into specific topics:
Caching and Performance:
Database and Storage:
AI System Design:
- Architecting Multi-Agent AI Swarms - System design deep dive into multi-agent orchestration patterns
Scaling Case Studies:
- How Netflix Video Processing Pipeline Works
- How OpenAI Scales PostgreSQL to 800M Users
- How Uber Finds Nearby Drivers at 1M RPS
- Slack System Design Architecture
- How Stripe Prevents Double Payment
- How WhatsApp Scales
Distributed Systems:
- How Consistent Hashing Works
- Role of Queues in System Design
- Circuit Breaker Pattern - prevent cascading failures in microservices
- Two-Phase Commit
- Distributed Counter Architecture
Operations and Deployment:
- Feature Flags: How to Deploy Code Without Releasing Features
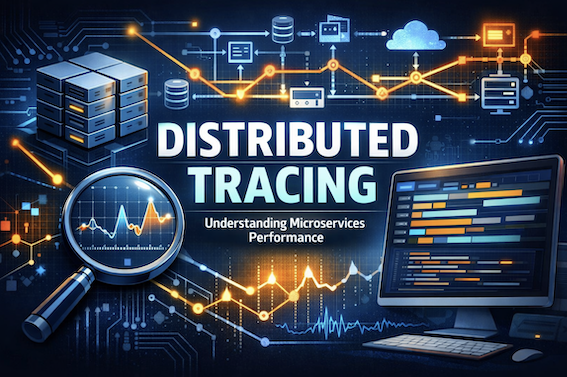
- Distributed Tracing: Jaeger vs Tempo vs Zipkin - how to trace requests across microservices
- OpenTelemetry in Production - Collector setup, sampling, and Kubernetes deployment
- Docker Cheat Sheet - Container commands and Dockerfile best practices
- Kubernetes Cheat Sheet
- Kubernetes Architecture
- Linux Commands Cheat Sheet
External Resources: