The JVM (Java Virtual Machine) runs the .class bytecode produced by javac. It works in three stages. First the class loader loads, links, and initializes your classes into memory. Then the JVM lays out runtime data areas like the heap (objects), the stacks (method calls), and the method area (class metadata). Finally the execution engine runs the bytecode: it starts by interpreting instructions one by one, then the JIT compiler turns frequently used hot methods into optimized native machine code, while the garbage collector reclaims memory from unused objects in the background. This design is what gives Java its Write Once, Run Anywhere promise.
You write a .java file, hit run, and a few moments later your program is alive. Between those two moments a surprising amount of machinery kicks in. Your human-readable code gets turned into a compact instruction set, loaded into memory, checked for safety, and then run by an engine that quietly rewrites the slow parts into fast native code while cleaning up memory behind your back. That engine is the Java Virtual Machine, and most developers use it every day without ever seeing inside.
Understanding how the JVM works is not academic trivia. It is the difference between staring blankly at an OutOfMemoryError and knowing exactly which memory area blew up. It explains why your service is slow for the first few seconds and then speeds up, why a tight loop suddenly gets faster, and what all those -Xmx and -XX flags actually control. Once you can picture the moving parts, Java stops feeling like magic.
This post walks through the whole journey: from source code to bytecode, through the class loader, into the runtime memory areas, and finally to the execution engine where interpretation, JIT compilation, and garbage collection happen. We will keep the language plain and use diagrams to make each stage concrete.
From Source Code to Bytecode
The JVM never reads your .java files. It reads bytecode. So the story starts with the compiler.
When you run javac App.java, the Java compiler translates your source into bytecode and writes it into a .class file. Bytecode is a compact, platform-independent instruction set. It is not machine code for Intel, ARM, or any specific CPU. It is machine code for an imaginary computer: the JVM.
Take this tiny method:
1
2
3
int add(int a, int b) {
    return a + b;
}
javac turns it into bytecode that looks roughly like this when you inspect it with javap -c:
1
2
3
4
iload_1      // push local variable a onto the operand stack
iload_2      // push local variable b onto the operand stack
iadd         // pop both, add them, push the result
ireturn      // return the top of the stack
Notice there are no CPU registers here. The JVM is a stack-based machine: instructions push and pop values on an operand stack rather than naming registers like eax or r0. This design keeps bytecode simple and portable.
That portability is the whole point. The bytecode for App.class is byte-for-byte identical whether you compiled it on a Mac or a Linux server. Only the JVM itself is built differently for each platform. This is Java’s famous Write Once, Run Anywhere promise, and it is why the same JAR file can run on your laptop and in a cloud container without recompiling.
flowchart LR
    A["fa:fa-file-code <b>App.java</b><br/>source code"] -->|javac| B["fa:fa-file <b>App.class</b><br/>bytecode"]
    B -->|loaded by| C["fa:fa-cogs <b>JVM</b><br/>runs anywhere"]
    C -->|JIT| D["fa:fa-microchip <b>Native code</b><br/>for this CPU"]

    classDef src fill:#dbeafe,stroke:#1d4ed8,stroke-width:2px,color:#0f172a
    classDef byte fill:#e0f2fe,stroke:#0891b2,stroke-width:2px,color:#0f172a
    classDef jvm fill:#c8e6c9,stroke:#16a34a,stroke-width:2px,color:#0f172a
    classDef nativec fill:#fff3e0,stroke:#f57c00,stroke-width:2px,color:#0f172a

    class A src
    class B byte
    class C jvm
    class D nativec
One thing worth clearing up early: the terms JDK, JRE, and JVM get mixed up constantly. The JVM is the engine that runs bytecode. The JRE (Java Runtime Environment) is the JVM plus the standard class libraries. The JDK (Java Development Kit) is the JRE plus developer tools like javac, jar, and the profilers. You build with the JDK and run on the JVM. If you want a tour of what the modern JDK ships with, the Java 25 features guide is a good companion read.
The Big Picture: JVM Architecture
Before we zoom into each stage, here is the whole machine in one view. The JVM has three major subsystems that work together:
- Class Loader Subsystem loads your
.classfiles into memory and prepares them. - Runtime Data Areas are the memory regions the JVM uses while running: heap, stacks, method area, and more.
- Execution Engine actually runs the bytecode, using an interpreter, a JIT compiler, and a garbage collector.
flowchart TD
    subgraph CL["fa:fa-boxes Class Loader Subsystem"]
        L1["Loading"] --> L2["Linking"] --> L3["Initialization"]
    end

    subgraph RDA["fa:fa-memory Runtime Data Areas"]
        H["Heap<br/>(objects, shared)"]
        MA["Method Area / Metaspace<br/>(class metadata)"]
        ST["JVM Stacks<br/>(per thread)"]
        PC["PC Registers"]
    end

    subgraph EE["fa:fa-microchip Execution Engine"]
        INT["Interpreter"]
        JIT["JIT Compiler<br/>(C1 + C2)"]
        GC["Garbage Collector"]
    end

    CL --> RDA
    RDA --> EE
    EE -->|calls native libs| JNI["fa:fa-plug JNI / Native Method Interface"]

    classDef loader fill:#dbeafe,stroke:#1d4ed8,stroke-width:2px,color:#0f172a
    classDef mem fill:#e0f2fe,stroke:#0891b2,stroke-width:2px,color:#0f172a
    classDef engine fill:#c8e6c9,stroke:#16a34a,stroke-width:2px,color:#0f172a
    classDef bridge fill:#fff3e0,stroke:#f57c00,stroke-width:2px,color:#0f172a

    class L1,L2,L3 loader
    class H,MA,ST,PC mem
    class INT,JIT,GC engine
    class JNI bridge
Everything else in this post is just a closer look at one of these three boxes. Let us start where your code enters the JVM: the class loader.
The Class Loader Subsystem
Java does not load your entire program up front. Classes are loaded lazily, the first time they are actually referenced. When the JVM meets a class it has not seen yet, the class loader runs it through three phases.
1. Loading
The class loader finds the .class file, reads its binary contents, parses the constant pool and metadata, and stores that information in the method area. It also creates one java.lang.Class object on the heap to represent the type. That Class object is the handle you touch whenever you use reflection, the same reflection that powers custom annotations and most frameworks.
Loading uses a parent-first delegation model with a chain of loaders:
- Bootstrap class loader loads the core
java.baseclasses likeStringandObject. It is written in native code and sits at the top. - Platform class loader loads standard platform modules such as
java.sqlandjava.xml. - Application (system) class loader loads the classes from your application’s classpath or module path.
When a loader is asked for a class, it first asks its parent, and only loads the class itself if the parent cannot. This delegation is a security feature: it stops someone from slipping in a fake java.lang.String and having it shadow the real one.
flowchart TD
    App["fa:fa-folder-open Application Class Loader<br/>your classpath"] -->|delegates up| Plat["fa:fa-folder Platform Class Loader<br/>java.sql, java.xml"]
    Plat -->|delegates up| Boot["fa:fa-lock Bootstrap Class Loader<br/>java.base core classes"]
    Boot -.->|not found, load here| Plat
    Plat -.->|not found, load here| App

    classDef top fill:#dbeafe,stroke:#1d4ed8,stroke-width:2px,color:#0f172a
    classDef mid fill:#e0f2fe,stroke:#0891b2,stroke-width:2px,color:#0f172a
    classDef bot fill:#c8e6c9,stroke:#16a34a,stroke-width:2px,color:#0f172a

    class Boot top
    class Plat mid
    class App bot
2. Linking
Linking prepares the loaded class to run. It has three sub-steps:
- Verification checks that the bytecode is well-formed and safe. It confirms the stack never underflows, types line up, and no instruction can jump outside the method. This is why you cannot hand the JVM arbitrary bytes and expect them to run: bad bytecode is rejected here with a
VerifyError. - Preparation allocates memory for
staticfields and sets them to default values (0,false,null). Your real values are not assigned yet. - Resolution replaces symbolic references in the constant pool (names like “the method
printlnonPrintStream”) with direct references that point to the actual memory location.
3. Initialization
Finally the JVM runs the class’s static initializers and static blocks, and assigns the real values to static fields, in the order they appear in the source. This happens exactly once per class and the JVM guarantees it is thread-safe. This is the phase that turns a loaded, linked class into one that is genuinely ready to use.
Runtime Data Areas: How the JVM Uses Memory
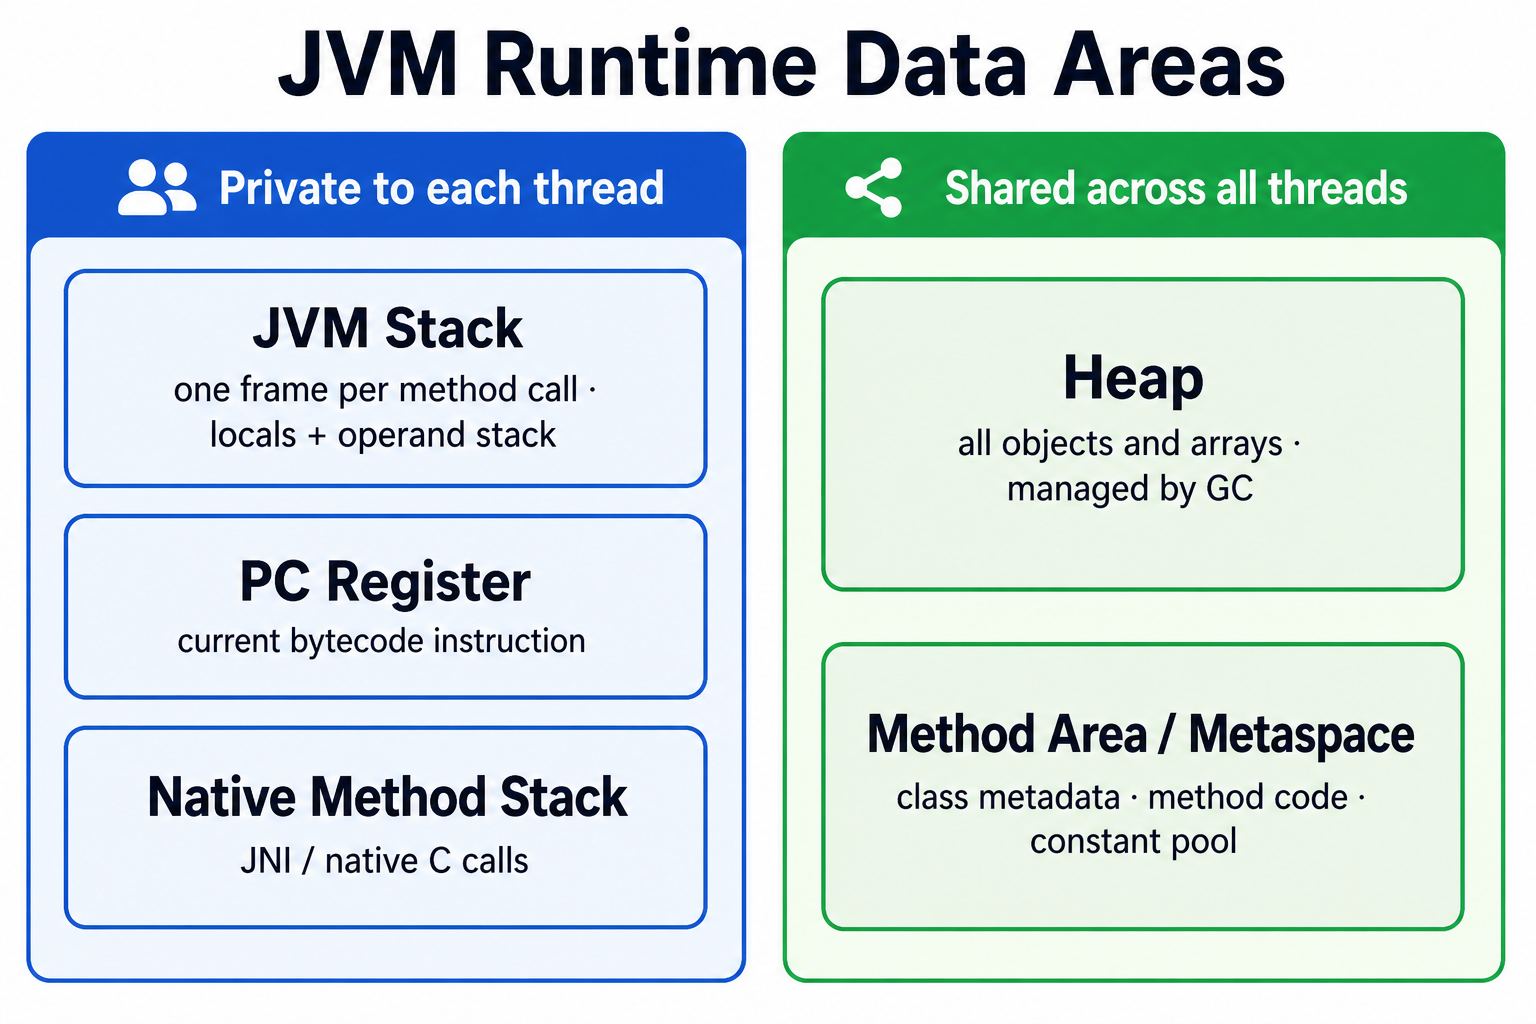
Once classes are loaded, the JVM needs somewhere to put everything: objects, variables, method calls, and class metadata. It divides memory into a handful of well-defined runtime data areas. Understanding these is the single most useful thing you can learn for debugging memory problems and doing JVM memory management well.
Some areas are shared by every thread. Others are private to each thread.
The heap
The heap is the big shared pool where every object and array lives. When you write new User(), the object is allocated on the heap. All threads share one heap, and it is the region the garbage collector manages. When people talk about tuning -Xmx (maximum heap size) or chasing a memory leak, the heap is what they mean. A java.lang.OutOfMemoryError: Java heap space means this area filled up and the GC could not free enough.
The method area (Metaspace)
The method area stores per-class information: the structure of each class, its methods’ bytecode, field details, and the runtime constant pool. In modern HotSpot JVMs this lives in Metaspace, which sits in native memory outside the main heap. Metaspace replaced the old fixed-size PermGen in Java 8, which is why OutOfMemoryError: PermGen space is a thing of the past and OutOfMemoryError: Metaspace took its place.
The JVM stacks
Each thread gets its own JVM stack. Every time you call a method, the JVM pushes a new frame onto that thread’s stack. A frame holds the method’s local variables and its operand stack (the scratch space those iload/iadd instructions use). When the method returns, its frame is popped. This is exactly why deep or infinite recursion throws StackOverflowError: you kept pushing frames until the stack ran out of room.
Because each thread has a private stack, local variables are naturally thread-safe. Objects on the shared heap are not, which is the root of most concurrency bugs.
PC register and native method stack
Each thread also has a program counter (PC) register that tracks which bytecode instruction it is currently executing, and a native method stack used when Java code calls into native C or C++ libraries through the JNI (Java Native Interface).
The Execution Engine: Interpreter and JIT
Now for the part that actually runs your code. The bytecode is loaded, memory is laid out, and the execution engine takes over. Here is the clever bit: the JVM does not simply interpret bytecode, and it does not simply compile it ahead of time. It does both, and it decides which to use on the fly.
Starting with the interpreter
When execution begins, the JVM interprets the bytecode: it reads one instruction, does what it says, moves to the next. Interpreting is slow per instruction, but it needs zero warmup, so your program starts almost instantly. This is why the interpreter is called Tier 0.
The problem is repetition. If a method runs a million times, interpreting it a million times wastes enormous effort doing the same translation over and over.
The JIT compiler kicks in
While the program runs, the JVM profiles it. It counts how often each method is called and how often loops spin. When a method crosses a threshold, it is declared hot, and the JIT (Just-In-Time) compiler compiles that method’s bytecode straight into optimized native machine code for your CPU. The next time the method is called, the JVM runs the fast native version instead of interpreting.
HotSpot, the standard JVM, uses tiered compilation with two compilers:
- C1 (the client compiler) compiles quickly with light optimizations. It gets hot code to native speed fast while gathering more profiling data.
- C2 (the server compiler) compiles more slowly but applies aggressive optimizations: method inlining, loop unrolling, dead code elimination, and escape analysis that can even avoid allocating short-lived objects on the heap.
flowchart LR
    T0["fa:fa-play <b>Tier 0</b><br/>Interpreter<br/>instant start, collects profile"] -->|method gets warm| C1["fa:fa-bolt <b>C1 Compiler</b><br/>fast native code<br/>light optimization"]
    C1 -->|method gets hot| C2["fa:fa-rocket <b>C2 Compiler</b><br/>aggressive optimization<br/>inlining, escape analysis"]
    C2 -.->|assumption breaks| T0

    classDef interp fill:#dbeafe,stroke:#1d4ed8,stroke-width:2px,color:#0f172a
    classDef c1 fill:#fff3e0,stroke:#f57c00,stroke-width:2px,color:#0f172a
    classDef c2 fill:#c8e6c9,stroke:#16a34a,stroke-width:2px,color:#0f172a

    class T0 interp
    class C1 c1
    class C2 c2
Why your app speeds up over time
This design explains a behavior every Java developer notices: an application is a little sluggish right after it starts, then gets faster and settles into a steady, quick pace. That is the JIT warming up, moving hot methods from interpreted to C1 to C2. It is the reason benchmarks always include a warmup phase before measuring.
The dashed line back to the interpreter in the diagram is deoptimization. C2 makes optimistic bets, for example “this method call always targets the same class.” If that bet later turns out wrong, the JVM throws away the compiled code and falls back to the interpreter, then may recompile with better information. This ability to speculate and recover is a big part of why a good JIT can sometimes rival, or even beat, statically compiled languages for long-running workloads.
Worth a mention: newer approaches like AOT (ahead-of-time) compilation with GraalVM Native Image compile bytecode to a native executable before running, trading peak throughput for near-instant startup and lower memory. That is a great fit for short-lived serverless functions, while the classic JIT still shines for long-running servers.
Garbage Collection: Automatic Memory Management
In languages like C, you allocate memory and you free it. Forget to free, and you leak. Free too early, and you crash. The JVM takes that whole burden off your hands with garbage collection. You just create objects; the GC figures out when they are no longer reachable and reclaims their memory on the heap.
Most JVM collectors are generational, based on a simple observation: most objects die young. A request handler creates a pile of temporary objects that become garbage almost immediately, while a few objects (caches, connection pools) live for the whole run.
flowchart LR
    subgraph Young["fa:fa-seedling Young Generation"]
        Eden["Eden<br/>new objects"] --> S0["Survivor spaces"]
    end
    subgraph Old["fa:fa-archive Old Generation"]
        Tenured["Long-lived objects"]
    end

    Eden -->|minor GC| S0
    S0 -->|survives enough<br/>collections| Tenured
    Tenured -->|major / full GC| Freed["fa:fa-check reclaimed"]

    classDef young fill:#c8e6c9,stroke:#16a34a,stroke-width:2px,color:#0f172a
    classDef old fill:#e0f2fe,stroke:#0891b2,stroke-width:2px,color:#0f172a
    classDef done fill:#fff3e0,stroke:#f57c00,stroke-width:2px,color:#0f172a

    class Eden,S0 young
    class Tenured old
    class Freed done
New objects are born in the young generation (specifically Eden). A quick, cheap minor GC sweeps it often, keeping the survivors and promoting the ones that stick around into the old generation. The old generation is collected less frequently with a more expensive major (or full) GC. Splitting memory this way means the GC spends most of its effort on the small young region where most garbage is, instead of scanning the whole heap every time.
The default collector in modern Java is G1 (Garbage-First), which splits the heap into regions and aims to keep pauses short and predictable. For latency-sensitive systems there are low-pause collectors like ZGC and Shenandoah that keep GC pauses to a few milliseconds even on large heaps. The trade-off is always the same triangle: throughput, latency, and memory footprint. Java performance tuning is largely about picking the right collector and heap sizes for your workload, then measuring.
Putting It Together: What Happens When You Run java App
Let us trace one real command end to end so the pieces click. Say you run:
1
java App
with this program:
1
2
3
4
5
6
7
8
9
10
11
public class App {
    public static void main(String[] args) {
        System.out.println(new Greeter().greet("world"));
    }
}

class Greeter {
    String greet(String name) {
        return "Hello, " + name;
    }
}
Here is what the JVM does:
- Launch. The
javalauncher starts a JVM process and asks the class loader forApp. - Load and link
App. The application class loader readsApp.class, verifies its bytecode, prepares its static fields, and resolves references. BecausemainusesSystem.out, the JVM also loads core classes likeSystemandString(via the bootstrap loader) if they are not already in memory. - Initialize
Appand start executingmainon the main thread. A new stack frame is pushed formain. new Greeter()triggers loading and initializing theGreeterclass the first time, then allocates aGreeterobject on the heap.- Call
greet("world"). A frame forgreetis pushed onto the main thread’s stack, holding thenamelocal variable. The string concatenation creates a newStringon the heap. - Interpret first, compile if hot. For a one-shot program like this, everything runs in the interpreter; nothing gets hot enough to JIT. In a real server, methods like
greetcalled millions of times would be compiled to native code by C1 then C2. - Print and return.
printlnruns, frames pop as methods return, and whenmainfinishes the main thread ends. - Garbage collection, if it ran at all, would reclaim the short-lived
GreeterandStringobjects once nothing references them.
Every Java program you have ever run, from a one-line demo to a huge microservice, follows this same shape. Speaking of larger systems, the same runtime powers many of the backend designs covered in the payment system design and notification system design guides.
JVM Tuning and Observability
You do not need to tune the JVM to use it, but knowing the levers helps when performance matters. A few of the most common flags:
-Xmsand-Xmxset the initial and maximum heap size. Setting them equal avoids resize pauses in production.-XX:+UseG1GC,-XX:+UseZGC, and similar choose the garbage collector.-XX:MaxMetaspaceSizecaps Metaspace so a class-loading leak cannot eat all native memory.-Xsssets the per-thread stack size.
For observability, the JDK ships tools that read the very data areas we discussed:
jpsandjcmdlist and command running JVMs.jstatreports live GC and heap statistics.jmapand heap dumps let you inspect what is filling the heap.- Java Flight Recorder (JFR) and Mission Control give low-overhead profiling suitable for production, and pair well with broader application performance monitoring setups.
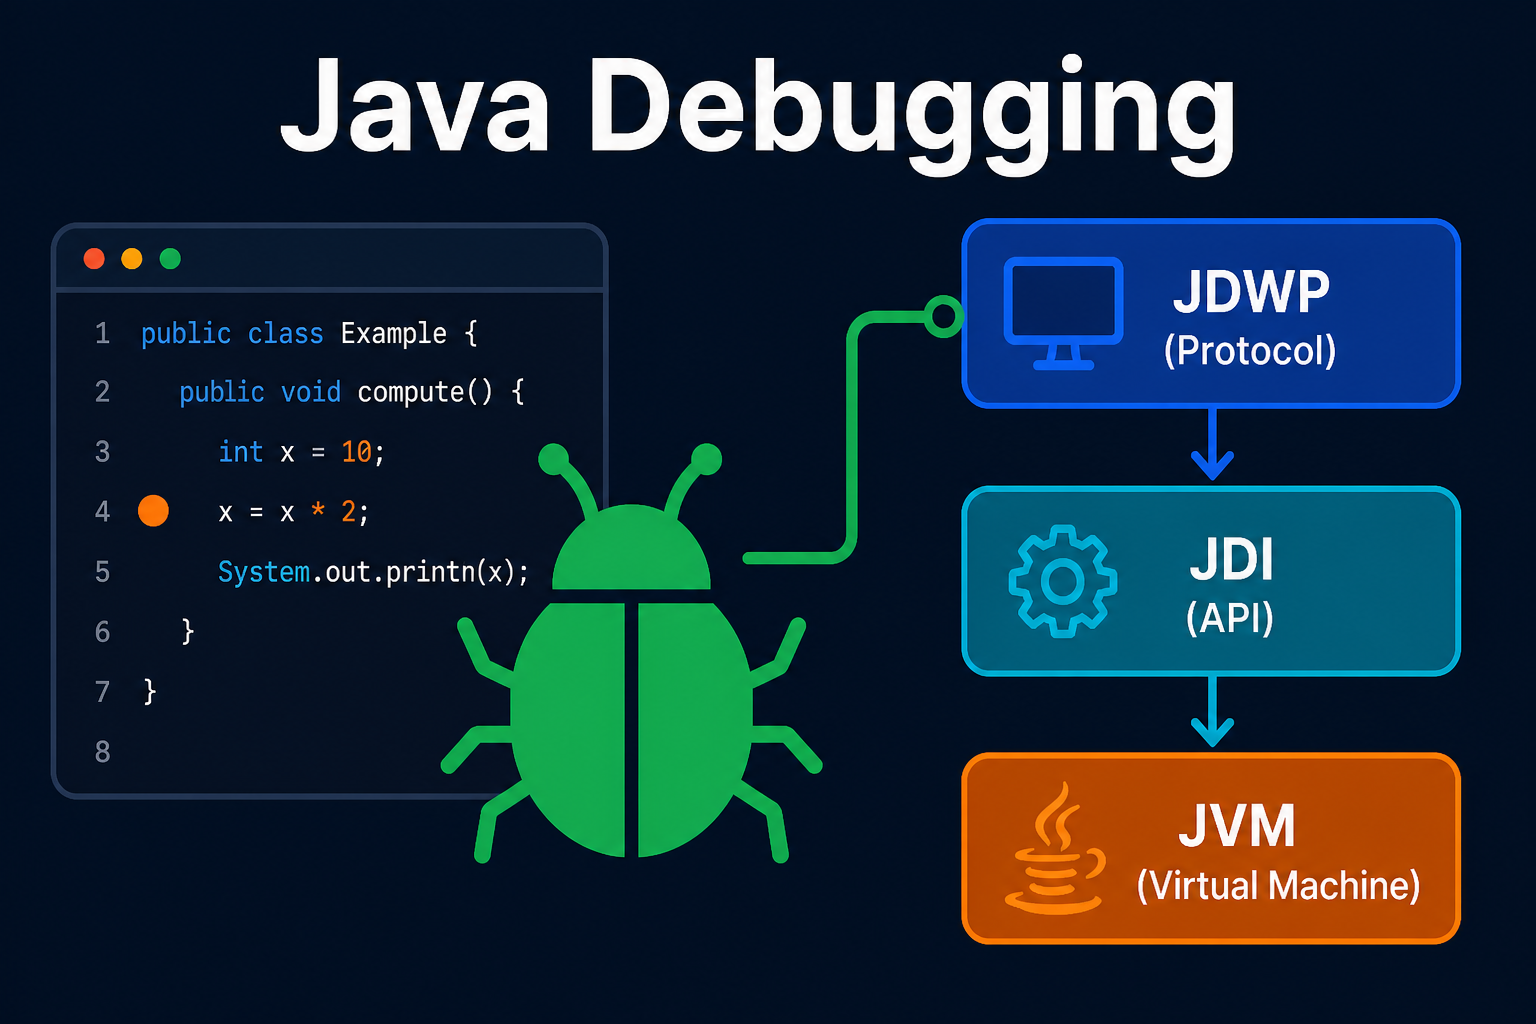
jdband the wider Java debugging architecture let you pause a running JVM, set breakpoints, and inspect live state through the same hooks the VM exposes.
The habit that matters most: measure before you tune. Guessing at flags without data usually makes things worse. Watch GC logs and real throughput, change one thing, and measure again.
Common Misconceptions About the JVM
A few myths trip up even experienced developers.
- “Java is interpreted, so it is slow.” Half true at best. Java starts interpreted, but hot code is JIT-compiled to native machine code. Long-running Java services routinely hit performance close to C++.
- “The garbage collector means no memory leaks.” The GC only frees unreachable objects. If you keep adding to a static
Mapand never remove entries, those objects stay reachable forever. That is a leak, and it will still throwOutOfMemoryError. - “More heap is always better.” A giant heap can mean longer GC pauses and wasted memory. The right size is the one your workload actually needs, found by measuring.
- “The JVM and the JDK are the same thing.” The JVM runs bytecode; the JDK is the full toolkit you build with. The JVM is one component inside it.
- “Bytecode is machine code.” Bytecode targets the imaginary JVM, not your CPU. The JIT is what finally produces real machine code.
Wrapping Up
The JVM can look intimidating from the outside, but its job breaks down into three clear stages. The class loader brings your .class files in, verifies them, and initializes them. The runtime data areas organize memory into a shared heap for objects and per-thread stacks for method calls. The execution engine runs your bytecode, starting with the interpreter for fast startup and handing hot methods to the JIT compiler for native speed, while the garbage collector quietly reclaims memory.
Once you can picture that flow, a lot of everyday Java makes more sense. You know which memory area an OutOfMemoryError points to, why your service warms up before it gets fast, and what your GC flags are really doing. You do not need to memorize the spec. Keep this mental model handy, reach for the JDK’s built-in tools when something goes wrong, and the JVM turns from a black box into a machine you can reason about.
Related posts:
- Java 25 LTS Features - What the newest JDK adds on top of everything here
- Java Custom Annotations - Uses the reflection and class metadata the loader builds
- Payment System Design - A backend design that runs on the JVM at scale
- Notification System Design - Another large system where JVM tuning matters
- Distributed Tracing: Jaeger vs Tempo vs Zipkin - Observability that complements JVM profiling
Further reading: the Java Virtual Machine Specification, the HotSpot Garbage Collection Tuning Guide, and Oracle’s Getting Started with the G1 Garbage Collector.