Stock prices flow through: Exchange → Ticker Plant (normalizes formats) → Kafka (distributes) → Broker Backend → WebSocket → Client. The fan-out problem (1 update to millions of users) is solved by Kafka topics and connection-per-user WebSockets. Total latency: 300-500ms from exchange to screen.
Open any stock trading app. Tap on a stock. Watch the price flicker green, then red, then green again. That number just changed 3 times in one second.
Behind that flickering number is one of the most demanding real-time systems in software engineering. Stock brokers handle millions of price updates every second and push them to millions of users watching their screens. The National Stock Exchange of India alone generates over 1 million messages per second during peak trading hours. Every single one of those messages needs to reach your phone before it becomes stale.
How do stock brokers handle real-time price updates at this scale? Let’s trace the journey of a stock price from the exchange floor to your screen.
The 400 Millisecond Race
When someone buys or sells a stock on an exchange, that trade creates a price update. This update needs to travel from the exchange’s servers to every broker, then to every user watching that stock.
The entire journey typically takes 300 to 500 milliseconds. Any slower, and traders start complaining. Much slower, and they switch to a competitor.
Here’s what that journey looks like:
flowchart TD
    A[Exchange] -->|50ms| B[Data Vendor]
    B -->|30ms| C[Broker Backend]
    C -->|100ms| D[Message Broker]
    D -->|50ms| E[WebSocket Server]
    E -->|150ms| F[Your Phone]

    style A fill:#fef3c7,stroke:#d97706,stroke-width:2px
    style B fill:#f1f5f9,stroke:#64748b,stroke-width:2px
    style C fill:#f1f5f9,stroke:#64748b,stroke-width:2px
    style D fill:#fee2e2,stroke:#dc2626,stroke-width:2px
    style E fill:#e0f2fe,stroke:#0284c7,stroke-width:2px
    style F fill:#dcfce7,stroke:#16a34a,stroke-width:2px
Let’s break down each step.
Step 1: The Exchange Broadcasts Everything
Stock exchanges are essentially giant matching engines. When a buy order matches a sell order, a trade happens. The exchange immediately broadcasts this information to everyone who’s paying for the data feed.
There are two types of data feeds:
Level 1 Data: The basic stuff. Last traded price, best bid price, best ask price, and volume. This is what most retail traders see.
Level 2 Data: The full order book. Shows all pending buy and sell orders at every price level. Professional traders and market makers need this to see market depth.
The exchange doesn’t send data to individual brokers directly. That would be a nightmare to manage. Instead, they broadcast using multicast UDP to data vendors and authorized recipients.
Why UDP? TCP is reliable but slow. It waits for acknowledgments. UDP just fires packets and moves on. In trading, getting 99.9% of updates instantly is better than getting 100% of updates with delays.
What about the missing 0.1%? Good systems detect gaps in sequence numbers and request retransmission through a separate TCP channel. You get speed for most messages and reliability as a backup.
Step 2: The Ticker Plant Does the Heavy Lifting
Before price data reaches users, it passes through something called a ticker plant. This is the unsung hero of stock market infrastructure.
A ticker plant is a specialized system that:
- Receives raw data from multiple exchanges
- Normalizes different data formats into a consistent structure
- Filters out noise and erroneous data
- Aggregates data from multiple sources
- Distributes processed data to downstream systems
flowchart TD
    subgraph Sources
        E1[NYSE]
        E2[NASDAQ]
        E3[BSE]
        E4[NSE]
    end

    subgraph Ticker Plant
        R[Receiver] --> N[Normalizer]
        N --> F[Filter]
        F --> A[Aggregator]
        A --> C[Cache]
    end

    subgraph Output
        D1[Trading]
        D2[Risk]
        D3[Clients]
    end

    E1 --> R
    E2 --> R
    E3 --> R
    E4 --> R
    C --> D1
    C --> D2
    C --> D3

    style R fill:#e0f2fe,stroke:#0284c7,stroke-width:2px
    style C fill:#fef3c7,stroke:#d97706,stroke-width:2px
Why Normalization Matters
Different exchanges use different data formats. NYSE might send:
1
{"sym": "AAPL", "px": 178.52, "ts": 1701432000000}
While NASDAQ sends:
1
{"symbol": "AAPL", "lastPrice": "178.52", "timestamp": "2025-12-01T10:00:00Z"}
The ticker plant converts both into a consistent internal format:
1
2
3
4
5
6
7
{
  "symbol": "AAPL",
  "price": 178.52,
  "timestamp": 1701432000000,
  "exchange": "NASDAQ",
  "type": "TRADE"
}
This normalized data flows through the rest of the system without every downstream service needing to understand each exchange’s quirks.
The Importance of Filtering
Exchanges occasionally send bad data. Fat finger errors, test messages, or corrupted packets. A good ticker plant catches these before they reach users.
Common filters include:
- Price sanity checks: If AAPL suddenly shows $0.01, something’s wrong
- Volume validation: Negative volume? Reject it
- Timestamp ordering: Messages arriving out of order need handling
- Circuit breaker integration: Respect trading halts
Step 3: Inside the Broker’s Backend
When the ticker plant delivers processed data, the broker’s backend takes over. This is where things get interesting from a software engineering perspective.
The Fan-Out Problem
One price update needs to reach thousands of users watching that stock. This is a classic fan-out problem.
Naive approach: Loop through all users interested in AAPL, send each one the update.
1
2
3
4
5
# Don't do this
def broadcast_price(symbol, price):
    interested_users = get_users_watching(symbol)
    for user in interested_users:  # Could be 100,000 users
        send_to_user(user, price)  # Sequential, slow
This doesn’t scale. If 100,000 users are watching AAPL and you’re processing updates sequentially, you’ll never keep up with the market.
The Solution: Message Brokers
Brokers use message queues like Kafka or Redis Pub/Sub to decouple data producers from consumers.
flowchart TD
    TP[Ticker Plant] --> K[Kafka]

    K --> C1[WS Server 1]
    K --> C2[WS Server 2]
    K --> C3[WS Server 3]
    K --> C4[WS Server N]

    C1 --> U1[25K Users]
    C2 --> U2[25K Users]
    C3 --> U3[25K Users]
    C4 --> U4[25K Users]

    style K fill:#fee2e2,stroke:#dc2626,stroke-width:2px
    style TP fill:#e0f2fe,stroke:#0284c7,stroke-width:2px
    style C1 fill:#fef3c7,stroke:#d97706,stroke-width:2px
    style C2 fill:#fef3c7,stroke:#d97706,stroke-width:2px
    style C3 fill:#fef3c7,stroke:#d97706,stroke-width:2px
    style C4 fill:#fef3c7,stroke:#d97706,stroke-width:2px
Kafka shines here because:
-
Partitioning: Stock symbols can be partitioned across brokers. All AAPL updates go to partition 1, all GOOGL updates go to partition 2, etc.
-
Consumer groups: Multiple WebSocket servers can read from the same topic, each getting a subset of partitions.
-
Replay capability: If a server crashes, it can replay recent messages from Kafka to catch up.
Here’s a simplified example of how this works:
1
2
3
4
5
6
7
8
9
10
11
12
13
14
15
16
17
18
19
20
# Kafka consumer in each WebSocket server
from kafka import KafkaConsumer

consumer = KafkaConsumer(
    'stock-prices',
    bootstrap_servers=['kafka:9092'],
    group_id='websocket-servers',
    auto_offset_reset='latest'  # Only care about fresh data
)

for message in consumer:
    price_update = json.loads(message.value)
    symbol = price_update['symbol']

    # Get WebSocket connections for this symbol
    connections = subscriptions.get(symbol, [])

    # Broadcast to all connected users
    for ws in connections:
        await ws.send_json(price_update)
Step 4: WebSockets Keep the Connection Alive
HTTP polling doesn’t work for real-time stock prices. Imagine making 10 HTTP requests per second, each with headers, authentication, and connection overhead. Your battery would die and servers would melt.
WebSockets solve this by establishing a persistent connection. Once connected, both client and server can send messages instantly without the overhead of new connections.
sequenceDiagram
    participant App
    participant WS as WS Server
    participant Kafka

    App->>WS: Connect
    WS->>App: Connected

    App->>WS: Subscribe AAPL
    WS->>WS: Track subscription

    Kafka->>WS: AAPL $178.52
    WS->>App: AAPL $178.52

    Kafka->>WS: AAPL $178.55
    WS->>App: AAPL $178.55

    Kafka->>WS: AAPL $178.51
    WS->>App: AAPL $178.51

    Note over App,Kafka: Connection stays open
Managing Subscriptions
Users don’t want updates for all 5,000 stocks on an exchange. They care about their watchlist and current holdings. The WebSocket server needs to track who wants what.
1
2
3
4
5
6
7
8
9
10
11
12
13
14
15
16
17
18
19
20
21
22
23
24
# Simple subscription management
class SubscriptionManager:
    def __init__(self):
        # symbol -> set of WebSocket connections
        self.subscriptions = defaultdict(set)
        # connection -> set of symbols
        self.user_subs = defaultdict(set)

    def subscribe(self, ws, symbol):
        self.subscriptions[symbol].add(ws)
        self.user_subs[ws].add(symbol)

    def unsubscribe(self, ws, symbol):
        self.subscriptions[symbol].discard(ws)
        self.user_subs[ws].discard(symbol)

    def disconnect(self, ws):
        # Clean up all subscriptions for this connection
        for symbol in self.user_subs[ws]:
            self.subscriptions[symbol].discard(ws)
        del self.user_subs[ws]

    def get_subscribers(self, symbol):
        return self.subscriptions[symbol]
Connection Limits
A single server can typically handle 50,000 to 100,000 concurrent WebSocket connections. Beyond that, you need more servers.
Brokers use load balancers to distribute connections across multiple WebSocket servers. When a server reaches capacity, new connections go to less loaded servers.
Step 5: The Client Makes It Look Simple
The mobile app or web interface has the easiest job, but it still needs to handle a few things:
Buffering and Batching
If a stock is moving fast, the server might send 10 updates per second. Updating the UI 10 times per second wastes battery and CPU. Smart clients batch updates.
1
2
3
4
5
6
7
8
9
10
11
12
13
14
15
16
17
18
19
20
21
class PriceBuffer {
    constructor(updateInterval = 100) {
        this.buffer = {};
        this.updateInterval = updateInterval;

        setInterval(() => this.flush(), updateInterval);
    }

    addUpdate(symbol, price) {
        // Keep only the latest price for each symbol
        this.buffer[symbol] = price;
    }

    flush() {
        // Update UI with latest prices
        for (const [symbol, price] of Object.entries(this.buffer)) {
            updatePriceDisplay(symbol, price);
        }
        this.buffer = {};
    }
}
Reconnection Logic
Connections drop. WiFi switches to cellular. The subway tunnel kills your signal. Good clients handle this gracefully.
1
2
3
4
5
6
7
8
9
10
11
12
13
14
15
16
17
18
19
20
21
22
23
function connectWebSocket() {
    const ws = new WebSocket('wss://broker.com/prices');

    ws.onopen = () => {
        console.log('Connected');
        // Resubscribe to symbols
        watchlist.forEach(symbol => {
            ws.send(JSON.stringify({action: 'subscribe', symbol}));
        });
    };

    ws.onclose = () => {
        console.log('Disconnected, reconnecting...');
        // Exponential backoff
        setTimeout(connectWebSocket, Math.min(1000 * Math.pow(2, retryCount), 30000));
        retryCount++;
    };

    ws.onmessage = (event) => {
        const update = JSON.parse(event.data);
        priceBuffer.addUpdate(update.symbol, update.price);
    };
}
Complete Stock Price Distribution Architecture
Let’s put it all together and see the full system architecture for real-time stock price updates:

Key Takeaways for Building Real-Time Systems
Building stock price systems teaches lessons that apply far beyond finance:
1. Push, Don’t Poll
Any time you’re polling for updates, ask yourself: can I push instead? WebSockets, Server-Sent Events, or long polling are almost always better than repeated HTTP requests.
Applies to: Chat applications, notifications, dashboards, collaborative editing.
2. Decouple Producers and Consumers
The ticker plant shouldn’t care how many WebSocket servers are running. WebSocket servers shouldn’t care how many users are connected. Message brokers like Kafka or Redis create clean boundaries between components.
Applies to: Any system where data flows from few sources to many destinations.
3. Normalize Early
Converting data to a consistent format at the edge saves endless headaches downstream. Every system after the ticker plant speaks the same language.
Applies to: Data pipelines, API integrations, ETL processes.
4. Batch at the Edges
The ticker plant batches updates before sending to Kafka. The client batches updates before rendering. Batching reduces overhead and improves throughput.
Applies to: Database writes, API calls, UI updates.
5. Plan for Failure
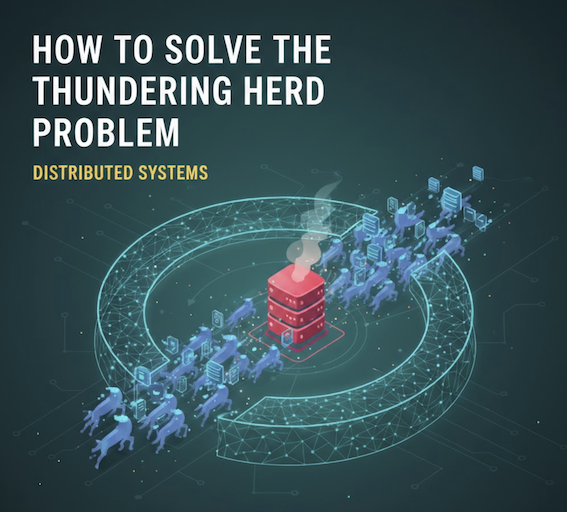
Connections drop. Servers crash. Networks partition. Good systems detect problems quickly and recover gracefully. Sequence numbers help detect gaps. Exponential backoff prevents thundering herds.
Applies to: Literally everything distributed.
6. Horizontal Scaling Is Your Friend
Need to handle more users? Add more WebSocket servers. More data? Add more Kafka partitions. This horizontal scaling model works because the architecture separates concerns cleanly.
Applies to: Any system expected to grow.
Stock Market Data: Scale and Performance Numbers
To give you a sense of how much data flows through these systems:
| Metric | Typical Value |
|---|---|
| Updates per second (busy stock) | 100-500 |
| Updates per second (entire market) | 500,000-2,000,000 |
| WebSocket connections per server | 50,000-100,000 |
| End-to-end latency target | < 500ms |
| Data feed bandwidth | 1-10 Gbps |
| Kafka throughput | 1-2 million messages/second |
High frequency trading firms care about microseconds. Retail brokers care about milliseconds. Both are fast enough that humans can’t tell the difference, but the engineering challenges are very different.
Common Mistakes to Avoid
Mistake 1: Using REST APIs for real-time data
I’ve seen teams build “real-time” dashboards that poll a REST API every second. This works for 100 users. It melts servers at 10,000 users.
Mistake 2: Ignoring backpressure
If the client can’t keep up with updates, what happens? Good systems drop old updates. Bad systems buffer until they run out of memory.
Mistake 3: Not handling reconnection
Mobile networks are unreliable. If your app doesn’t reconnect automatically with exponential backoff, users will complain.
Mistake 4: Sending everything to everyone
Users watching AAPL don’t need GOOGL updates. Filtering on the server saves bandwidth and battery.
Mistake 5: Ignoring time synchronization
When debugging latency issues, you need synchronized clocks. NTP is a minimum. Precision Time Protocol (PTP) is better.
Wrapping Up
Real-time stock price systems are a masterclass in distributed systems engineering. They combine:
- High-throughput data ingestion
- Message-driven architecture
- Persistent connections
- Horizontal scaling
- Graceful failure handling
The same patterns that power your stock trading app also power live sports scores, multiplayer games, and collaborative tools like Figma and Google Docs.
Next time you watch a stock price flicker on your screen, you’ll know the journey it took to get there. And maybe you’ll appreciate the engineering that makes it look so effortless.
Want to dive deeper into real-time systems? Check out WebSockets Explained for the protocol basics, How Google Docs Works for collaborative editing at scale, and Building a Dynamic Rate Limiter for protecting these systems at scale.